From Outreach to Achievement
At St John’s we’re proud to have a thriving Inspire Programme that works to raise the attainment and aspirations of pupils aged 5 to 18 from the local community, our link regions and across the country. Last year, over 4000 pupils attended one of our in-school or virtual workshops or were welcomed to in-college visits, study days and summer schools.
Whilst our work isn’t limited to engaging those that might apply to St John’s or even to Oxford, we’re delighted that many of pupils do. In each year that the Inspire Programme has been running, more participants went on to study at Oxford than any other university.
In May 2023, the University published their 6th Annual Admissions Statistical Report summarising the undergraduate admissions data by region, disadvantage, school type, gender, ethnicity and disability. Included within this report are several breakdowns by subject and by college setting out where progress has been made and where there is still much work to be done.
Top 5 for progress on admitting state-school and socio-economically disadvantaged students
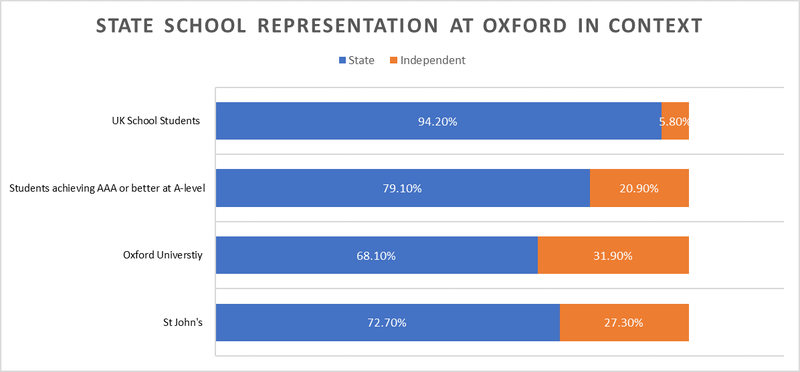
We’re pleased to announce that St John’s is in the top five colleges for representation of socio-economically disadvantaged students (ACORN Groups 4 & 5) – 20.4%, and state school-educated students – 72.7%, highlighting the excellent work of our Access & Admissions team in promoting higher education to disadvantaged students. (Data averaged across 2020–22 admissions cycles).
Of students who achieve AAA or better at A-level across the country, 79.1% are from state schools and 20.9% are at independent schools.
The Wider University
In the past five years (2018–22), there have been key improvements at a university-wide level.
Amongst UK undergraduate student admissions, there has been an increase in the proportion of state school students from 60.5% to 68.1%, an increase in the proportion of students identifying as Black and Minority Ethnic from 18.3% to 27.8%, an increase in proportion of students from socio-economically disadvantaged areas from 11.3% to 15.5%, and an increase in the proportion of students from areas of low progression to higher education from 13.1% to 16.6%. (The figures relating to disadvantage and progression to higher education are derived from the ACORN and POLAR systems. ACORN is a postcode-based tool which subdivides the UK population by socio-economic advantage whilst POLAR measures the likelihood of young people to progress to higher education based on where they live.)
In 2022, 7.3% of UK students admitted to Oxford were eligible for Free School Meals. This is an increase of 2 percentage points since 2021.
We know that there is more work to be done in addressing significant education disparities within our link regions, and within those applying to Oxford. Nevertheless, we are proud of the progress that we have made and look forward to seeing the impact of our access and outreach work in these reports for years to come.